How to Measure a Planet creates imaginary topographies by using environmental data—temperature, height, and pressure—from two locations on Earth. The project is both a method and a representation, metaphorically connecting these two points through topography-related data. At its core, it is a device that transforms collected environmental data into a 2D plane drawing, offering an alternative approach to understanding landscapes and the relationships between elevation and environmental factors.
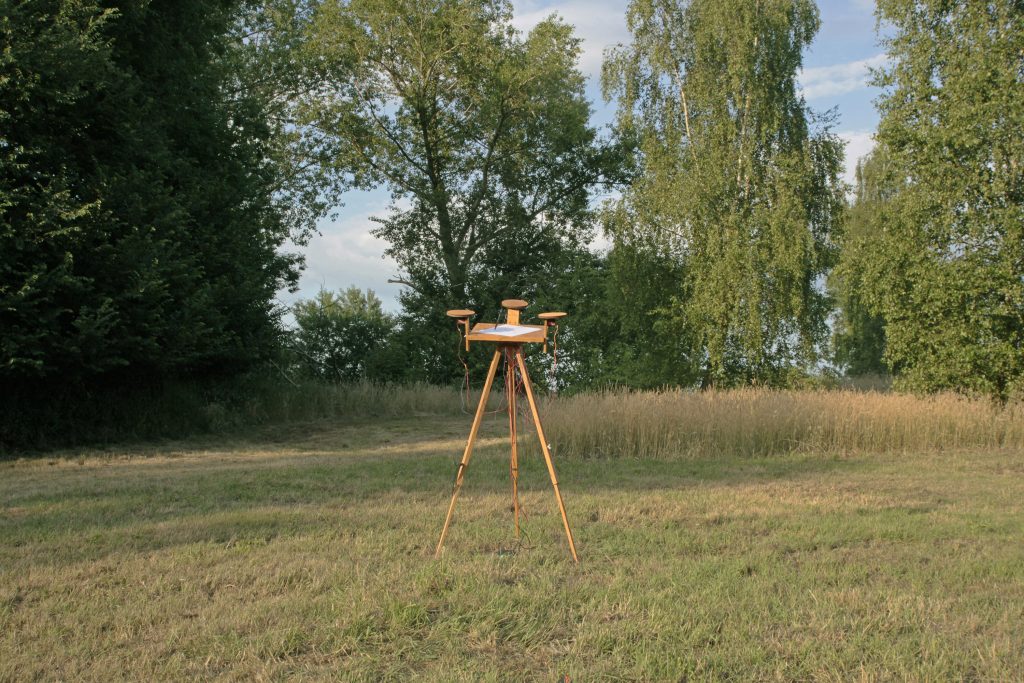
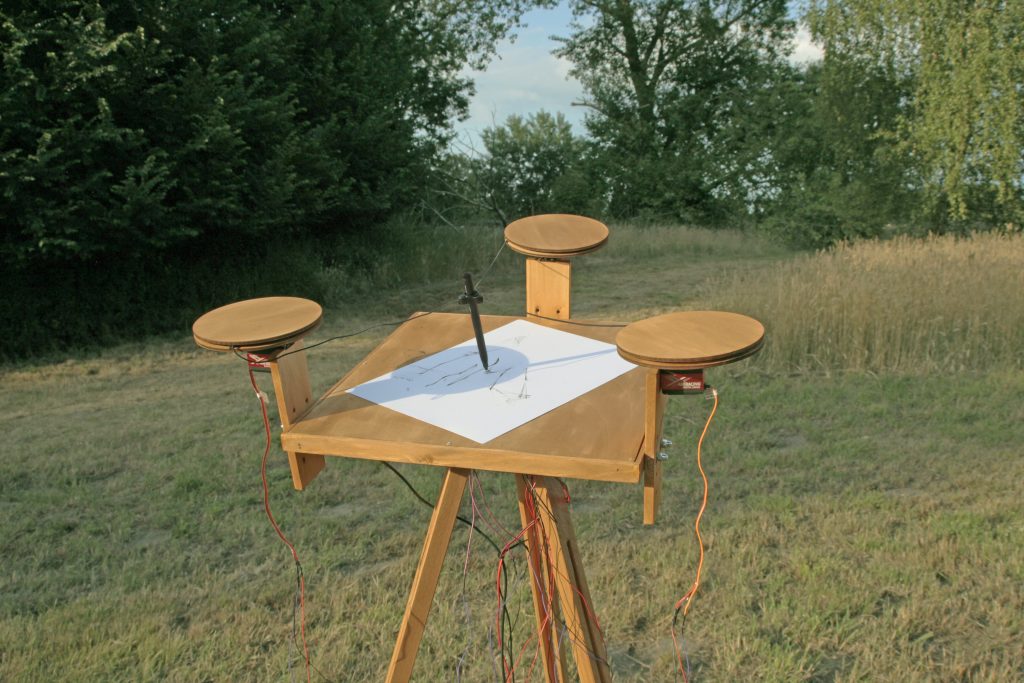
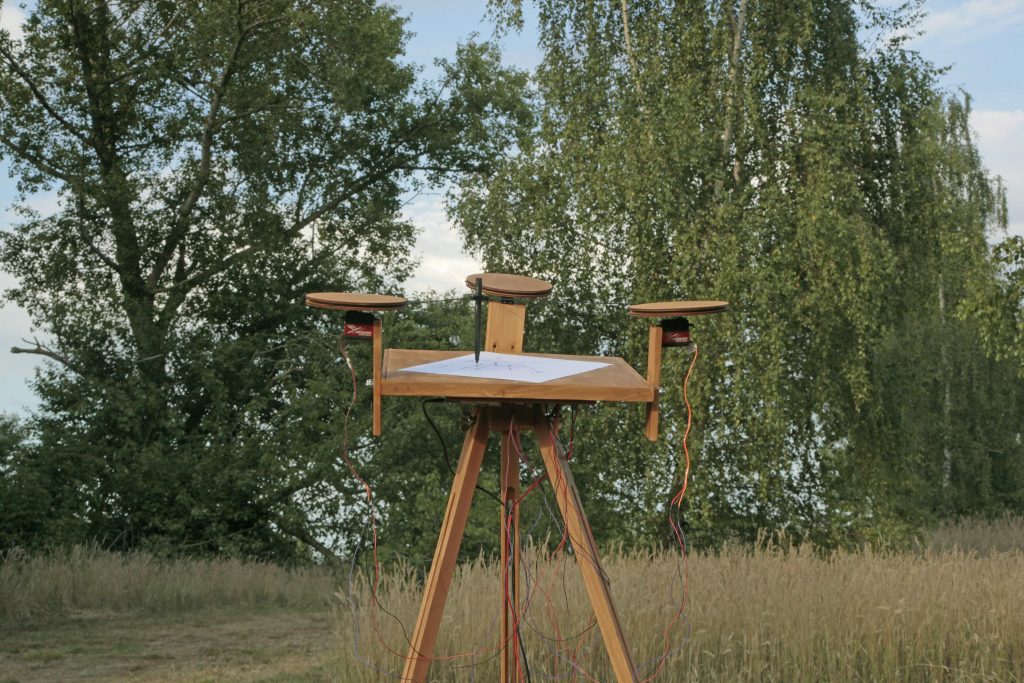
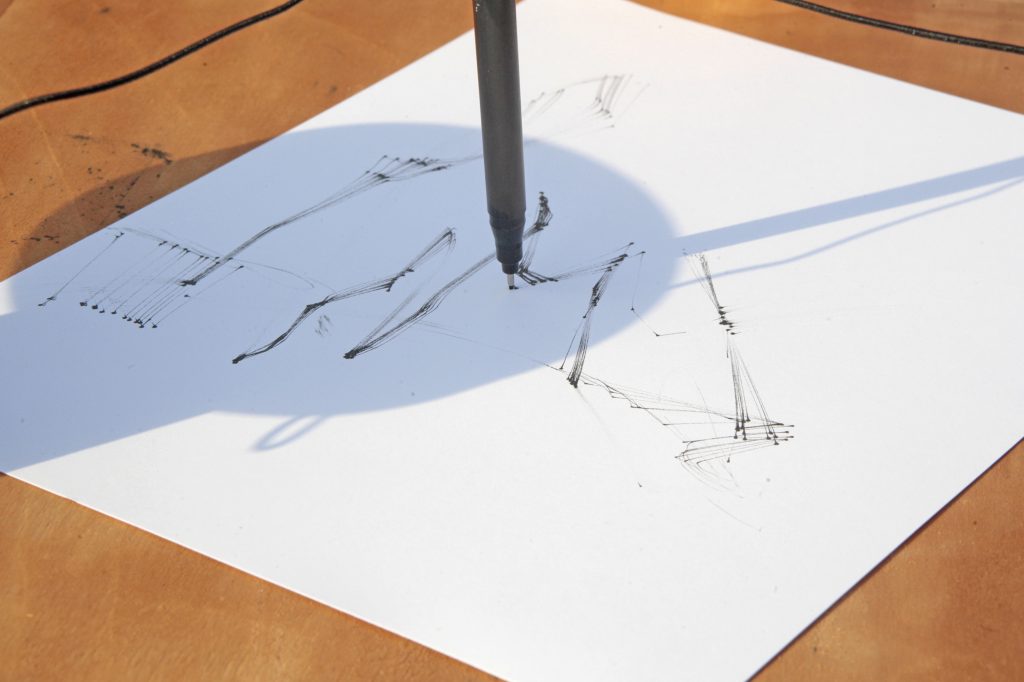
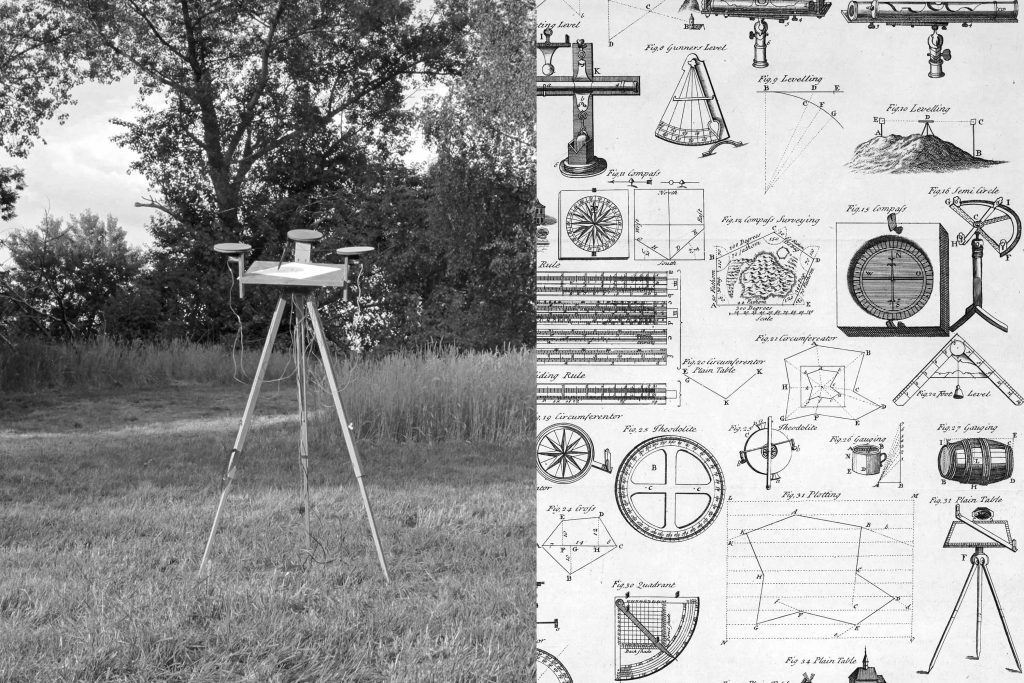
The machine employs three servomotors to translate digital information into mechanical movement, guiding a pencil as it draws. Each motor is controlled by one of the three data inputs, creating a representation that reflects the interplay of environmental conditions with elevation. This process bridges the geographical and perceptual differences between the two chosen locations, highlighting the contrasts between them while proposing new ways to connect to the places we inhabit.
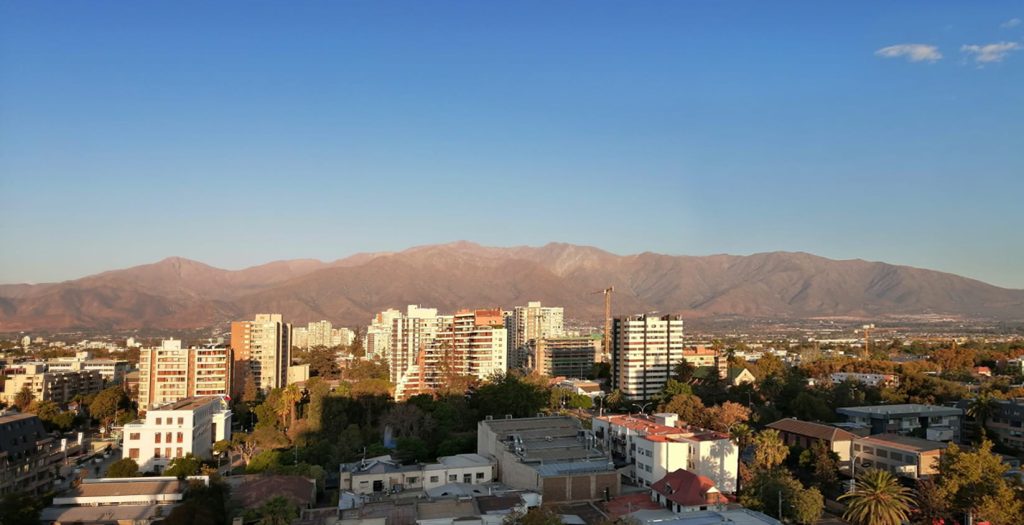
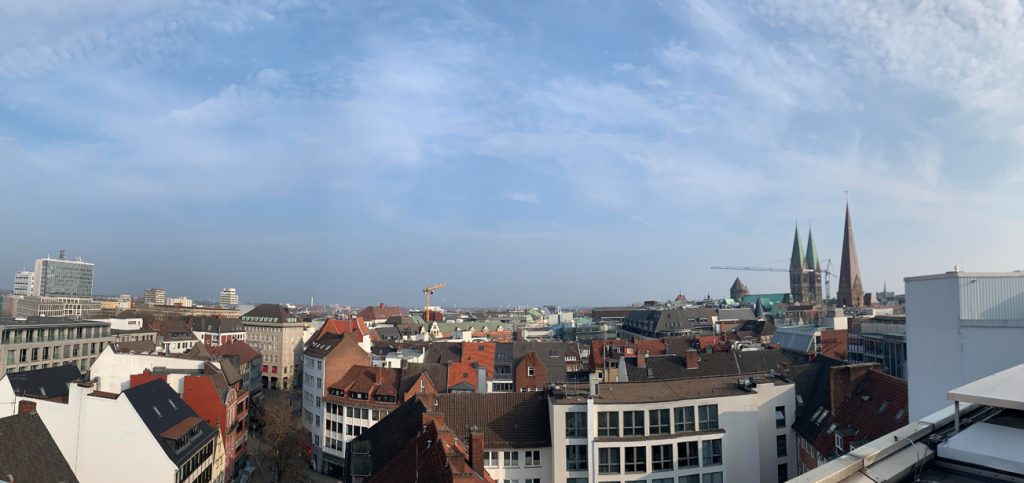
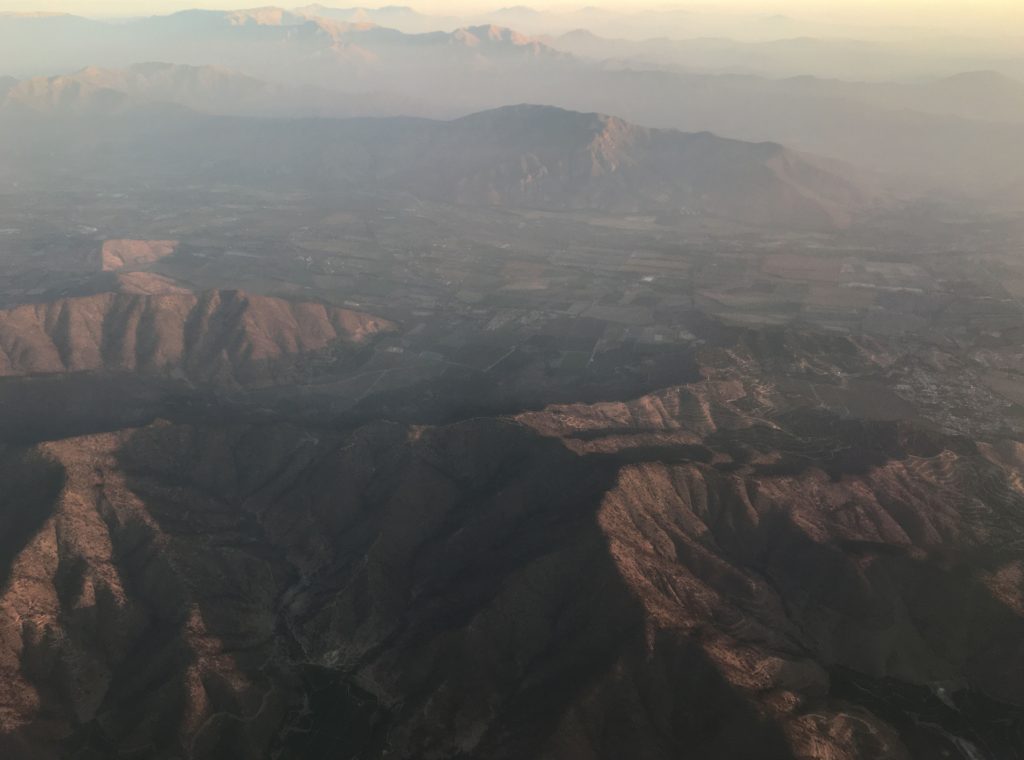
The inspiration for the project stems from the extreme contrast between the two places where I have lived: the dramatic mountains of Santiago and the flat landscapes of Bremen. This contrast awakened a personal longing for homeland landscapes and a desire to bridge the distance between these two places. Through this work, I explore how the geographical differences of particular territories can generate a metaphorical connection—one that transforms environmental data into a reflection of my own experience of place and displacement.
Germany
How to make differences appear
Is it possible to connect two points on Earth based on their geographic characteristics? And more specifically, on their height differences? How can we create a conceptual crossover between technology, geography, and the way we perceive the places we inhabit? With this starting point, I began to think about a device that would help me to translate these landscape differences into a material state.
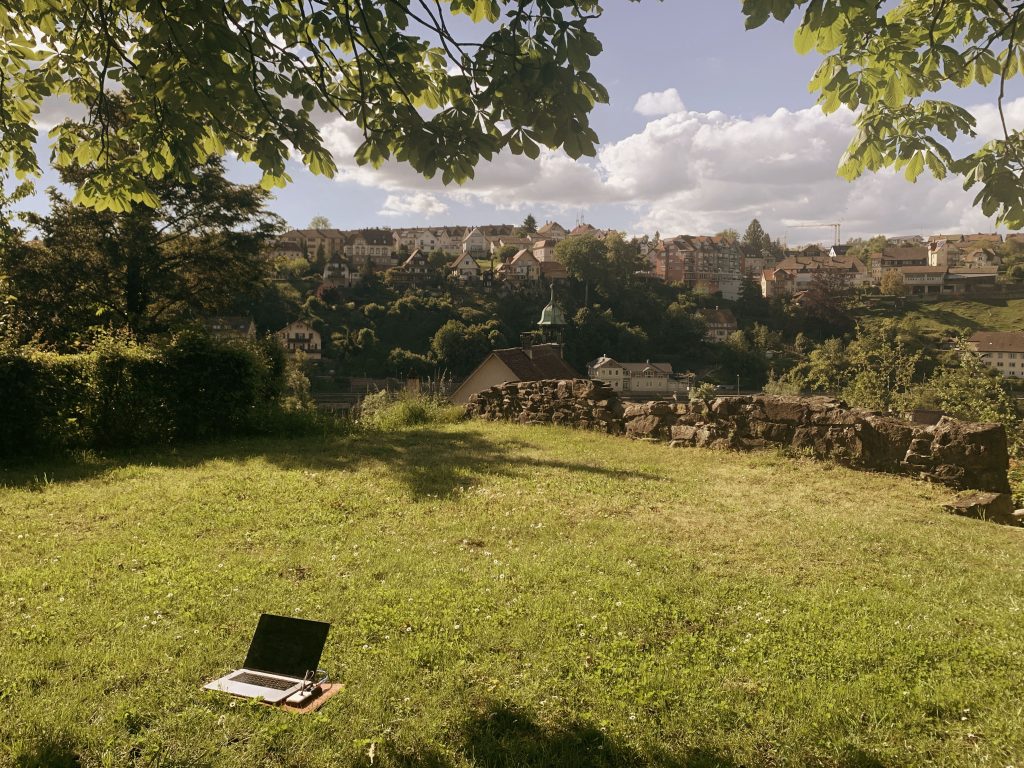
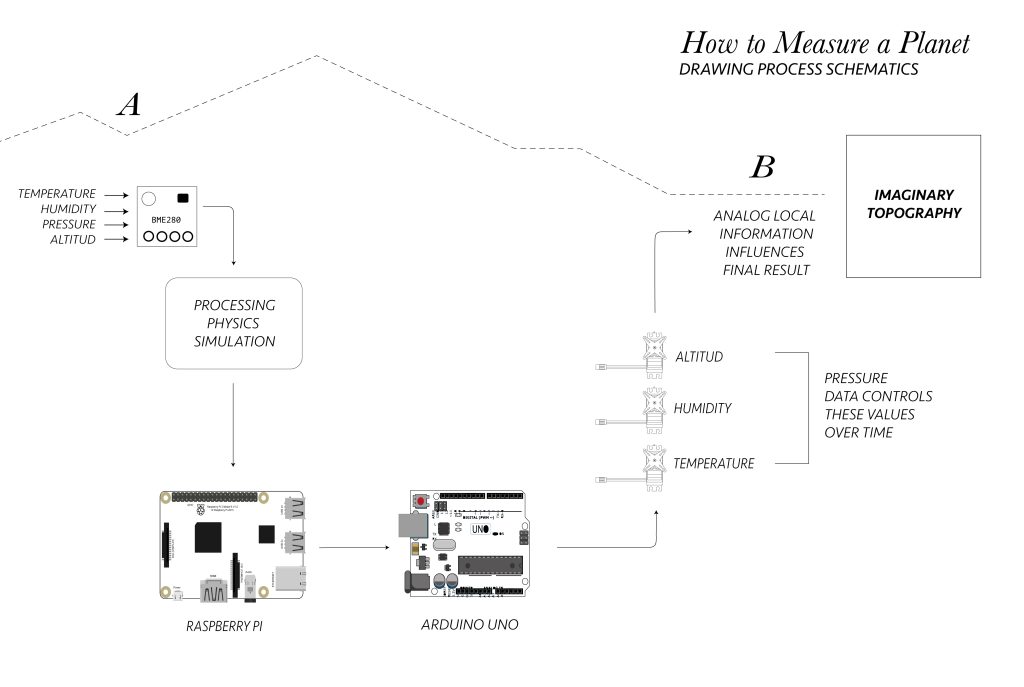
I started by using a barometric sensor connected to an Arduino microcontroller. The sensor captures humidity, temperature, and pressure. However, with a simple formula, it also calculates the altitude of a given place, considering that atmospheric pressure decreases with increasing elevation.
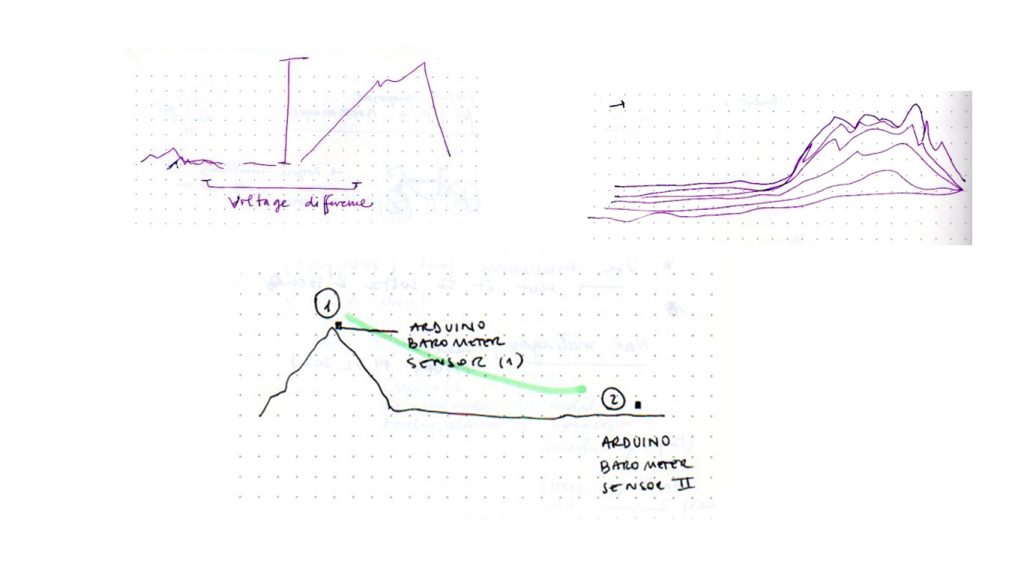
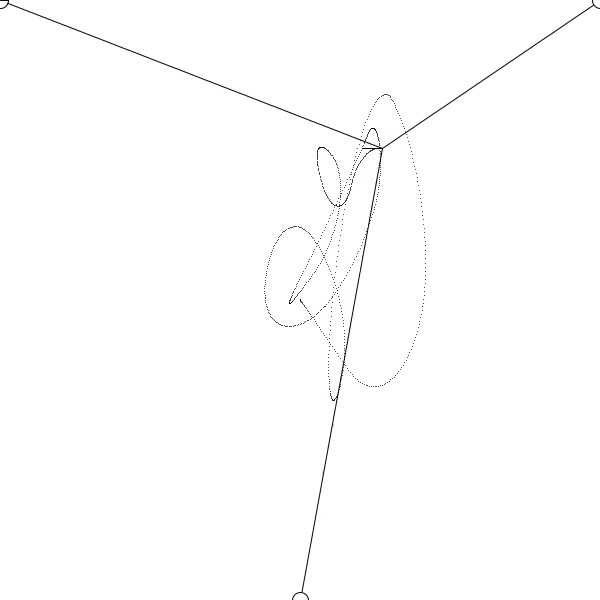
With the data collected, the next step was to create a device that embodied the idea of linking two places. I developed a simulation in Processing software, using the Box2D library, a physics engine library. This same simulation (hosted on a Raspberry Pi board), controls an Arduino UNO microcontroller which, in turn, controls the movement of the servomotors. Every servomotor is connected by an elastic cord, with a drawing object in the middle. Their movement is controlled by one of the data stated above (temperature, pressure, altitude). Pivot forces pull the pencil in opposite and unpredictable directions, creating unique marks on the canvas.
How to Measure a Planet:
Collect data in situ, from a given place.
Write a software and let it process your collected data
into a physics simulation.Use the collected data and mix it with analogous data from elsewhere (wind, rain, geomagnetism, etc.) obtained with the help of a measuring-drawing machine.
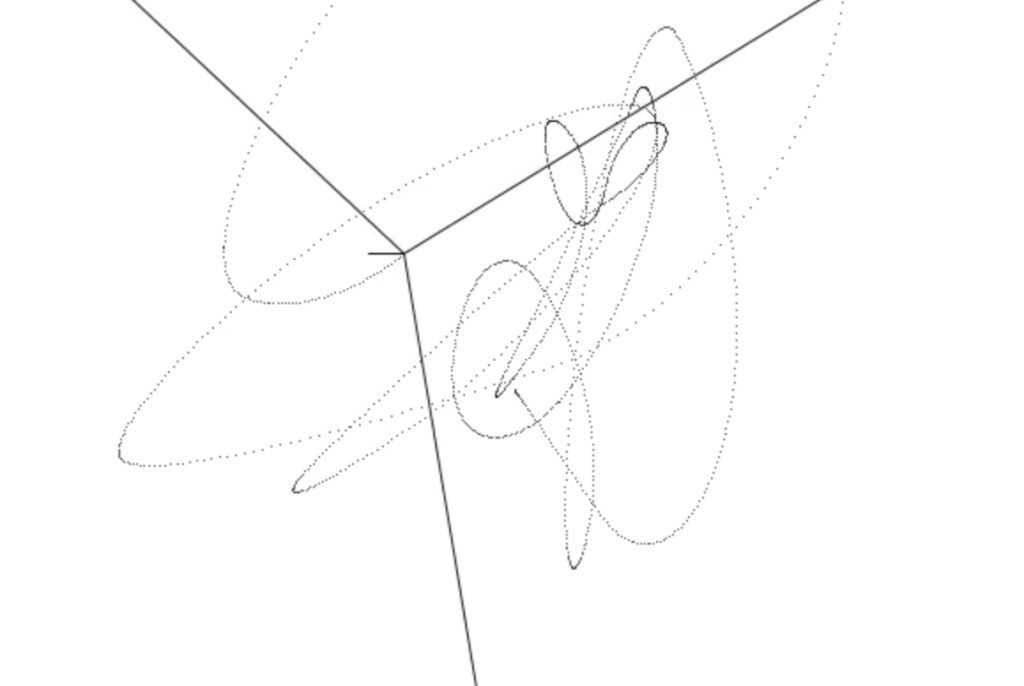
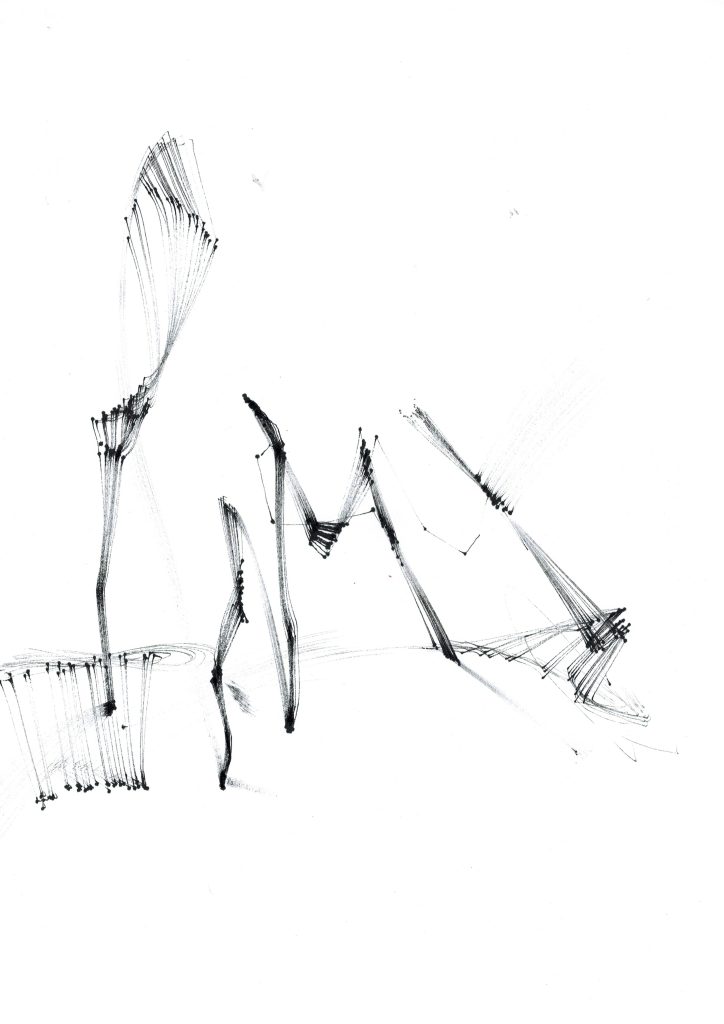
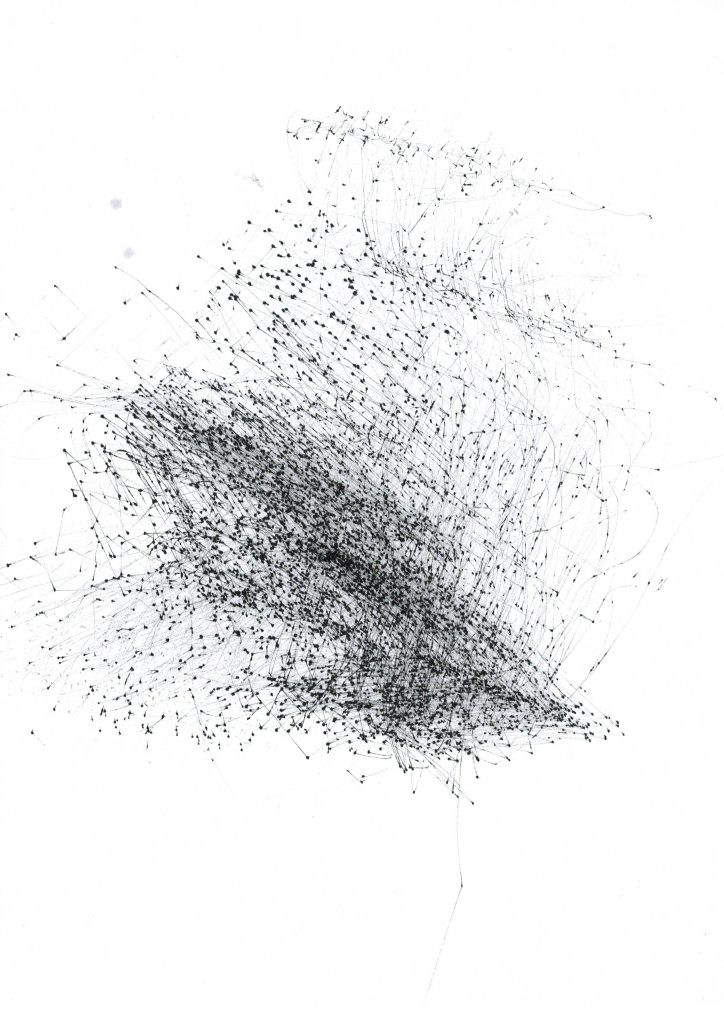
As a result, an imaginary topography of two given locations is drawn.
Drawings / Imaginary topographies
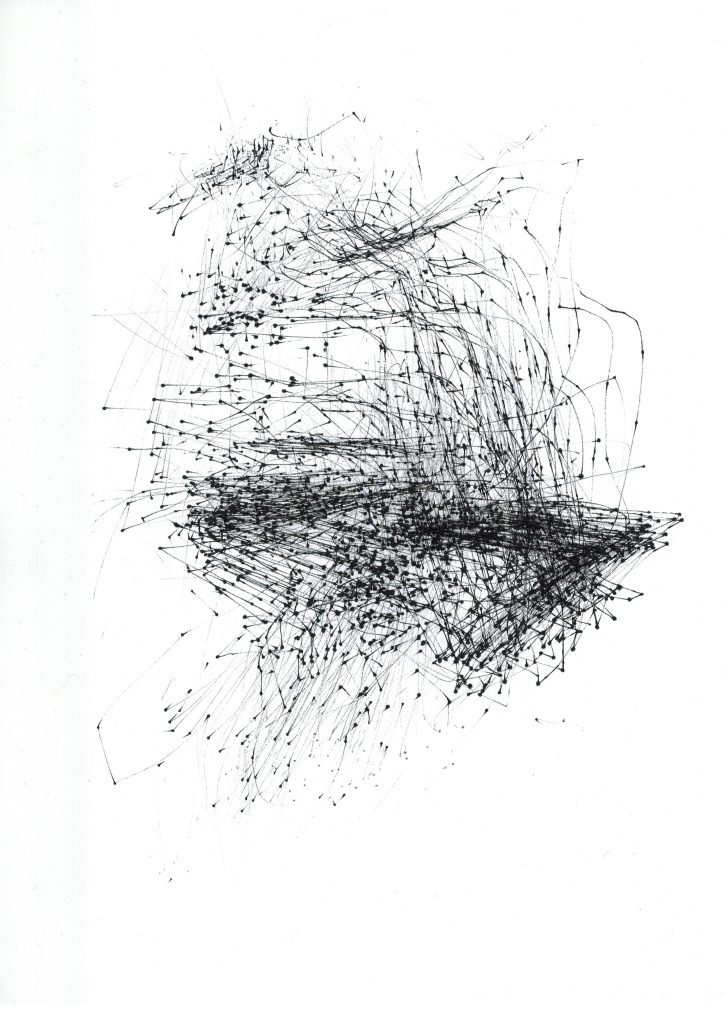
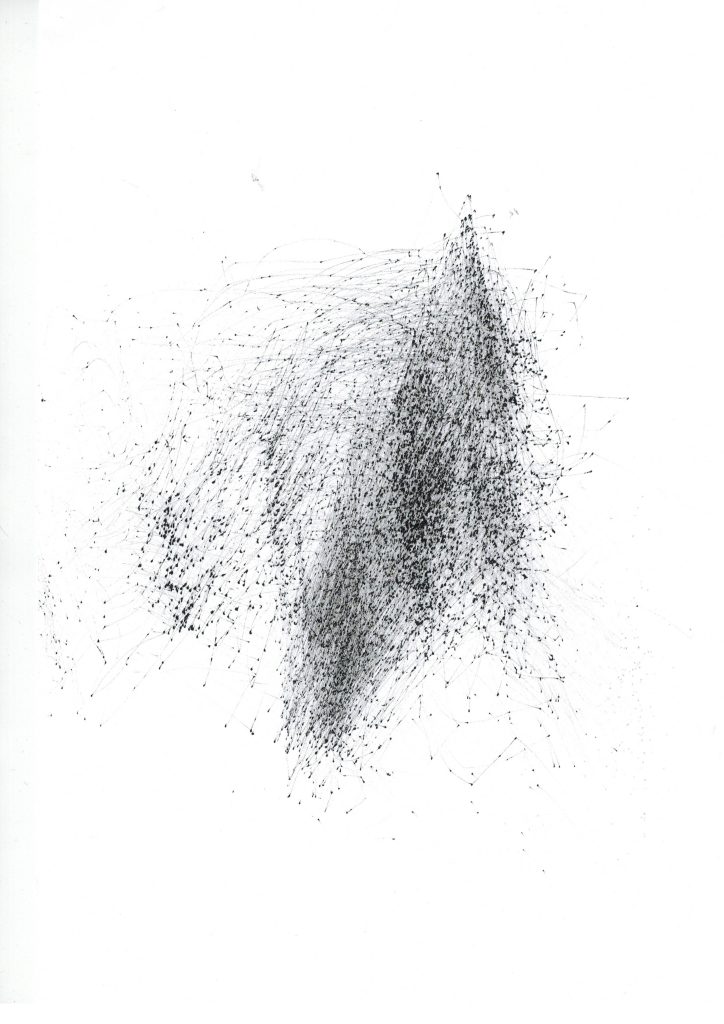
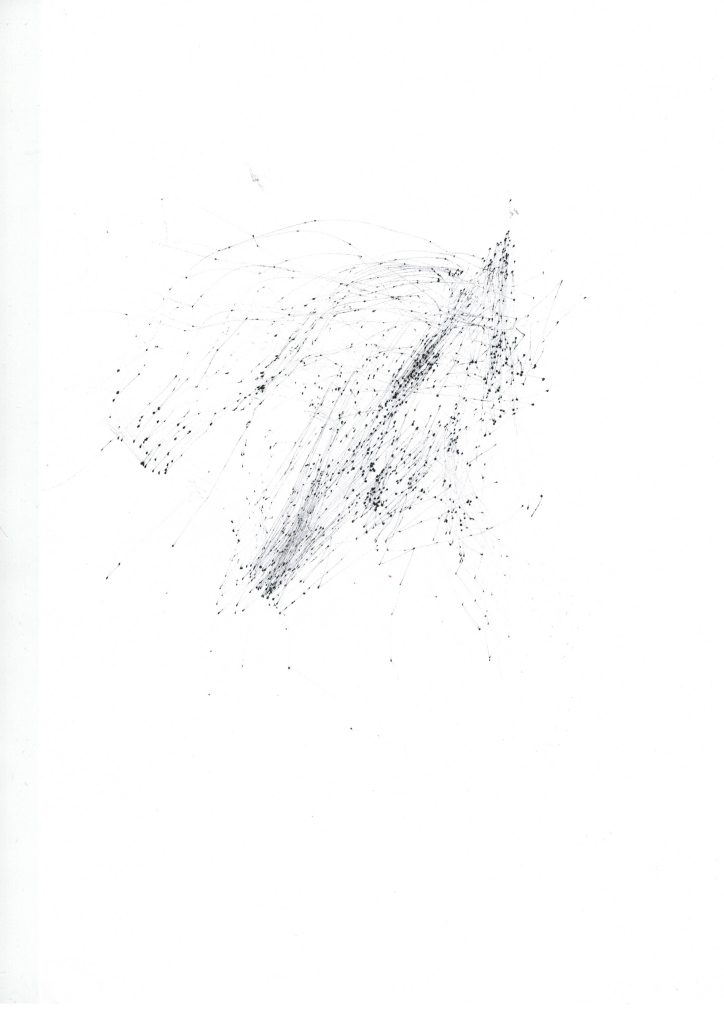
The drawings above were all drawn by the machine. Some in a couple of hours and some in the course of a couple of minutes. The data the machine works with are always the same, in this case, the data related to the height of the Laufenburg area in Switzerland. Nevertheless, every time the machine runs, factors related to its set-up change every time the starting point and, in turn, the way in which each arm of the machine pulls the elastics. This also influences how these physical forces interact with the drawing pencil and thus, the final result.
In the future, I hope to feed the machine with data collected in Chile and drawn in Germany, or viceversa.
References
– 1944 Think like a Mountain. Aldo Leopold (book)
– 2007 What is an Aesthetic Apparatus? Jean-Louis Déotte (book)
– 2020 The Cordillera of Dreams. Patricio Guzmán (documentary)
Open Source Software
Processing simulation and Arduino code for Hochschultage 2022 version
- Ars Electronica 2023
- Hoschultage (2022) University of the Arts Bremen
- Learning to Draw (2022) University of the Arts Bremen
- "WHAT I KNOW ABOUT HIGH AND LOW - A Link Between Geography and Voltage" Published online on The Dynamic Archive
- "Geographies of Coapparation: How to Measure a Planet" Coapparation I, II, III Printed publication. thealit.
- Antonio Hofmeister for his technical assistance
- Ralf Becker for his conceptual support
- Anamaría Daza
- Jörg Reichenberg